Using Inspect Element to Find Answers
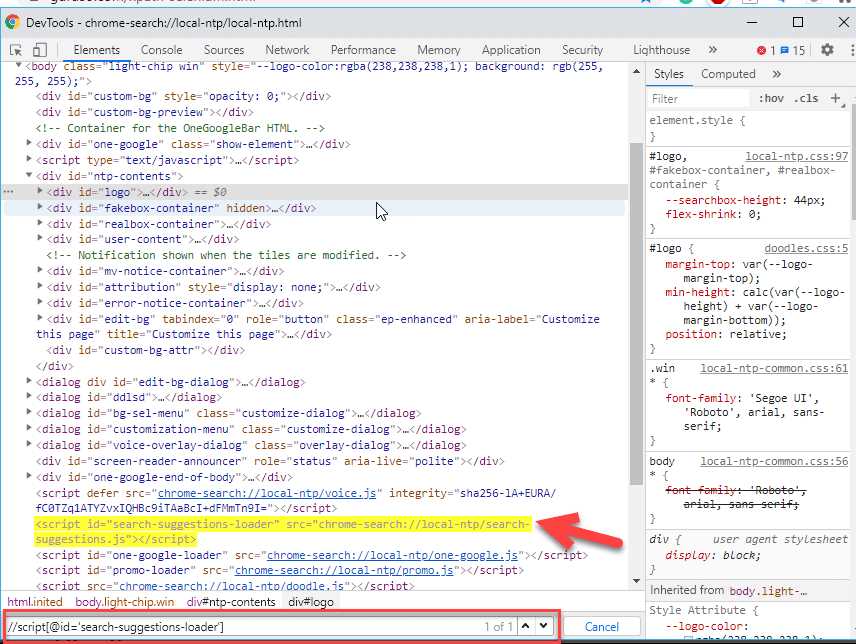
In the digital world, understanding how websites operate behind the scenes can provide valuable knowledge for developers, marketers, and curious users alike. Whether you’re troubleshooting, optimizing, or simply exploring, there are tools built into browsers that allow you to deeply examine how a page functions.
These tools give you direct access to various layers of a webpage, enabling you to observe the structure, code, and behavior of different elements. With just a few clicks, you can uncover information that is typically hidden from plain sight, making it easier to solve problems, improve performance, or learn more about web development.
By leveraging these browser features, you gain a deeper understanding of the inner workings of any site. This process is essential for anyone looking to improve their skills in web analysis or development.
Using Inspect Element to Find Answers
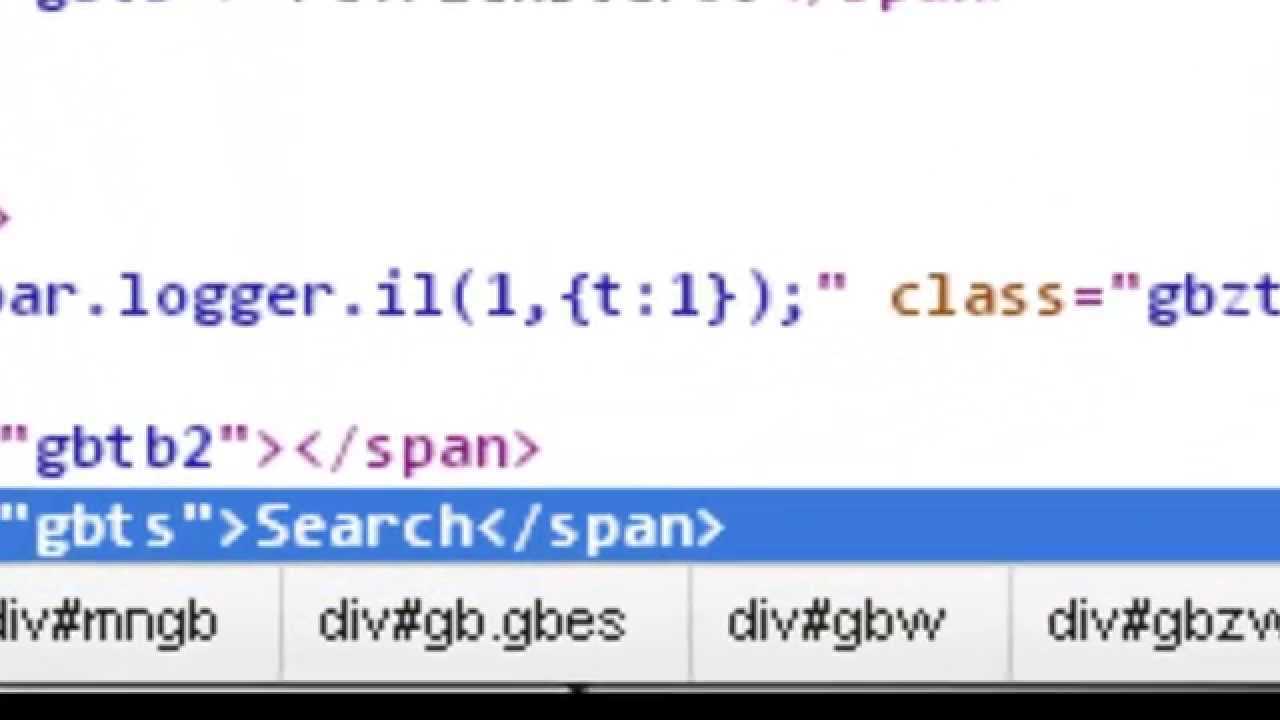
When you’re troubleshooting or seeking specific details on a webpage, having access to the underlying structure and data can be invaluable. There are built-in browser tools that allow you to explore the hidden layers of a site, making it easier to gather crucial information or fix issues that may not be immediately visible.
By leveraging these features, you can:
- Examine the HTML structure to locate specific sections or hidden elements.
- Analyze the CSS styles that are applied to various parts of a page.
- Track errors or unusual behavior in JavaScript that may affect functionality.
- Access network requests to identify performance issues or broken resources.
These tools empower you to interact directly with the website, giving you the ability to quickly identify and correct issues, or simply gain a deeper understanding of how the page operates. Whether you are looking to improve the user experience or learn more about the technical side of web development, these features provide a direct path to the information you need.
What is Inspect Element
This powerful tool allows users to examine and interact with the internal structure of a webpage. It provides a way to view the underlying code, track behaviors, and analyze how a website is designed and functions. Accessible directly through most web browsers, it enables you to explore elements like HTML, CSS, and JavaScript, giving you a detailed perspective on the components of a site.
How It Works
When you activate this feature, it opens a panel that displays the code responsible for rendering the webpage in your browser. You can see various sections of the page, such as text, images, and forms, along with the specific code that controls them. This allows for quick editing and testing of different elements without affecting the live site.
Who Benefits from It
Web developers and designers use this tool regularly to troubleshoot and optimize websites. It also aids marketers and SEO professionals by offering insights into a page’s structure, load performance, and potential issues. Even casual users can use it to better understand how websites work and troubleshoot minor problems they encounter while browsing.
How to Access Inspect Element
To explore the internal structure and data of a webpage, you can access a built-in tool directly from your browser. This feature is available in most modern web browsers and can be triggered with just a few simple actions. Once opened, it grants you detailed control over how elements of the page are rendered, allowing you to investigate and manipulate the content in real-time.
Accessing Through Browser Menus
The most straightforward way to open this tool is through the browser’s context menu. Simply right-click anywhere on a webpage and select the option labeled “Inspect” or “Inspect Element” from the menu that appears. This will open the developer panel, displaying the HTML and CSS of the page, along with other useful information such as network requests and JavaScript errors.
Using Keyboard Shortcuts
If you prefer a quicker method, most browsers support keyboard shortcuts to open this tool. On Windows, pressing Ctrl + Shift + I will launch it, while on macOS, the shortcut is Cmd + Option + I. These shortcuts can save time when you need to access the tool frequently during development or troubleshooting.
Understanding the Developer Tools
Developer tools provide a set of features that help you analyze, troubleshoot, and optimize web pages. These built-in utilities are available in most modern browsers, offering detailed access to the structure, behavior, and performance of websites. By utilizing these tools, users can gain valuable insights into how a page is constructed and how its components interact with each other.
Key Features of Developer Tools
The developer panel is divided into several tabs, each serving a unique purpose. Common tabs include:
- Elements – Displays the HTML and CSS of the page, allowing you to view and edit content in real-time.
- Console – Shows logs and messages from the webpage’s scripts, useful for debugging JavaScript errors.
- Network – Tracks all network requests made by the page, including images, scripts, and API calls.
- Performance – Analyzes the page’s load speed and resource consumption, helping with optimization.
How to Leverage These Tools
By mastering the developer tools, you can quickly identify issues such as broken links, slow-loading resources, or errors in the code. For web developers, this feature is indispensable for testing and refining a site’s design and functionality. Marketers and content creators can also use these tools to understand page performance and make informed decisions about SEO and user experience enhancements.
Inspecting HTML Elements on a Page
When exploring the structure of a webpage, one of the most powerful tools at your disposal is the ability to view and analyze the HTML markup that builds the page. This allows you to see how the content is organized and how various elements are connected. By examining the source code, you can uncover details such as hidden text, links, images, and other important components that may not be visible on the surface.
The HTML structure is often organized in a hierarchical format, with various tags that define the content. Each tag serves a specific function, and understanding how they interact can help you troubleshoot, modify, or optimize a webpage. Here’s an overview of common HTML tags you might encounter while exploring a site:
| Tag | Description |
|---|---|
| <div> | Defines a container for grouping content. |
| <a> | Represents a hyperlink to another page or resource. |
| <img> | Embeds an image into the webpage. |
| <p> | Defines a paragraph of text. |
| <span> | Defines a small section of text for styling or grouping purposes. |
By interacting with these tags, you can make changes, experiment with different layouts, and understand how the page is rendered in the browser. This process is essential for anyone looking to improve a site’s design, troubleshoot display issues, or gain a deeper understanding of how web content is structured.
Locating Specific Information with Inspect
When working with a webpage, it’s often necessary to locate certain pieces of information that might be buried within the code. Whether you’re trying to identify a specific image, find a hidden text element, or track down a broken link, the ability to navigate the page’s structure efficiently is essential. This process allows you to access and modify the content in real-time, providing a deeper understanding of how different elements interact.
To locate specific content, you can focus on several key techniques:
- Search by Tag: Identify the type of content you’re looking for by searching for the corresponding HTML tag. For example, you can locate all links by searching for the
<a>tag. - Use Class or ID Attributes: Elements with unique classes or IDs can be easily identified through the code. These attributes are often used to style or manipulate specific sections of the page.
- Search for Text: You can also search for specific keywords or phrases in the text, which will help pinpoint relevant sections of the page quickly.
- Track Media Files: To find images, videos, or other media, look for
<img>or<video>tags, or search for their file paths within the code.
By applying these methods, you can easily navigate through the page’s code to locate and work with the exact elements you need. This ability is particularly helpful when diagnosing issues or extracting content for analysis or further development.
How to Modify Page Styles
Customizing the appearance of a webpage in real-time can be incredibly useful, whether you’re experimenting with design elements or troubleshooting layout issues. By accessing the visual properties of a page, you can quickly adjust things like colors, fonts, spacing, and positioning to see how changes would affect the overall look of the site. This process allows for quick edits without making permanent changes to the underlying code.
To modify the visual appearance of a page, follow these basic steps:
- Open the Style Editor: Locate the section of the browser tool that displays the CSS rules for the page. This is often found in the “Styles” or “CSS” tab of the developer tools.
- Select an Element: Click on any visible component of the page (such as text, images, or buttons). This will highlight the corresponding code in the panel, where you can see the styles applied to that element.
- Edit CSS Properties: Once the element is selected, you can modify its style properties. For instance, change the background color by adjusting the
background-colorproperty or alter text size with thefont-sizerule. - Preview Changes: As you edit the styles, the page will automatically update, allowing you to instantly preview your modifications before applying them permanently.
This method is an effective way to experiment with design tweaks, test new ideas, and even debug layout issues, all without affecting the live website. It’s a great tool for designers, developers, and anyone looking to refine the user experience of a site.
Finding Hidden Content with Inspect
On many websites, certain content is intentionally hidden from view, either for design purposes, security, or to be revealed later through interactions. Accessing this concealed information can be helpful for troubleshooting, research, or simply understanding how the page is structured. With the right tools, you can reveal and explore these hidden elements, gaining insight into parts of the page that aren’t immediately visible.
Here are a few methods to uncover hidden content:
- Look for Hidden HTML Tags: Some content may be wrapped in
<div>or<span>tags with adisplay: none;orvisibility: hidden;CSS property. By locating these tags, you can manually change the styles to make the content visible. - Reveal Collapsible Sections: Many pages use JavaScript to hide sections like menus or product details. These areas are often controlled by dynamic scripts. You can search for the JavaScript functions or event listeners associated with the hidden sections and trigger them manually.
- Adjust Element Styles: If an element is invisible due to CSS rules like
opacity: 0orvisibility: hidden, you can edit these properties in the style editor to display the content. Simply change the value tovisibleor increase the opacity to 1. - Check for Off-Screen Content: Some content is positioned outside the viewport to be revealed upon scrolling or interaction. By examining the CSS, you can modify the positioning properties (such as
top,left, ortransform) to bring the hidden content into view.
By understanding how these techniques work, you can uncover all the content on a page, including sections hidden from normal users or used for interactive features. This can be particularly useful for developers testing new features or users investigating hidden data.
Inspect Element for Debugging Websites
When working on website development, identifying and fixing issues is a crucial part of the process. Whether it’s a layout problem, broken link, or styling issue, troubleshooting can often be a challenge. However, with the right tools, you can quickly pinpoint and address these problems by examining the structure and styling of the page in real time. This approach makes it easier to identify what’s wrong and make adjustments on the spot without altering the live code directly.
Common Debugging Scenarios
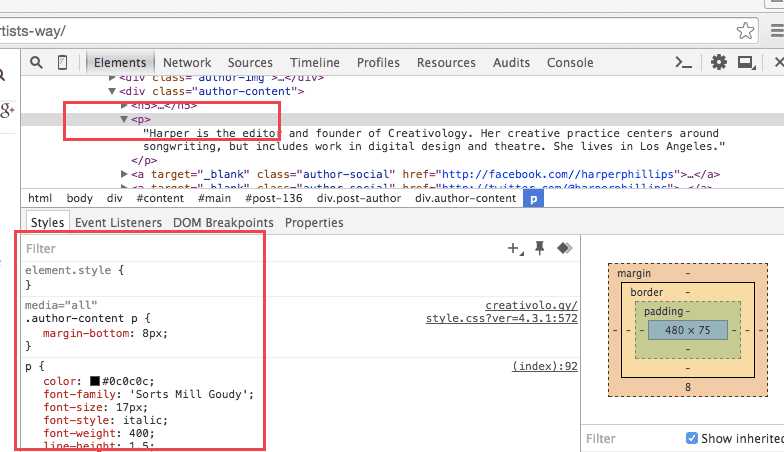
Here are some of the most common issues you might encounter and how you can use the browser’s tools to debug them:
- Layout Problems: When elements don’t align or are mispositioned, inspect the CSS properties such as
margin,padding,width, andposition. Adjusting these values can immediately help fix alignment and layout issues. - Broken Links: Check the
<a>tags for incorrect href attributes. Broken links or missing resources often point to non-existent URLs, which can be quickly corrected by inspecting the source code. - Missing Media: If images or videos aren’t loading, you can inspect the
<img>or<video>tags to ensure the correct file paths and URLs are used. - CSS Styling Errors: For design inconsistencies, review the applied styles and check for conflicting rules. Overridden properties or missing declarations are easy to identify through the style editor.
Practical Debugging Steps
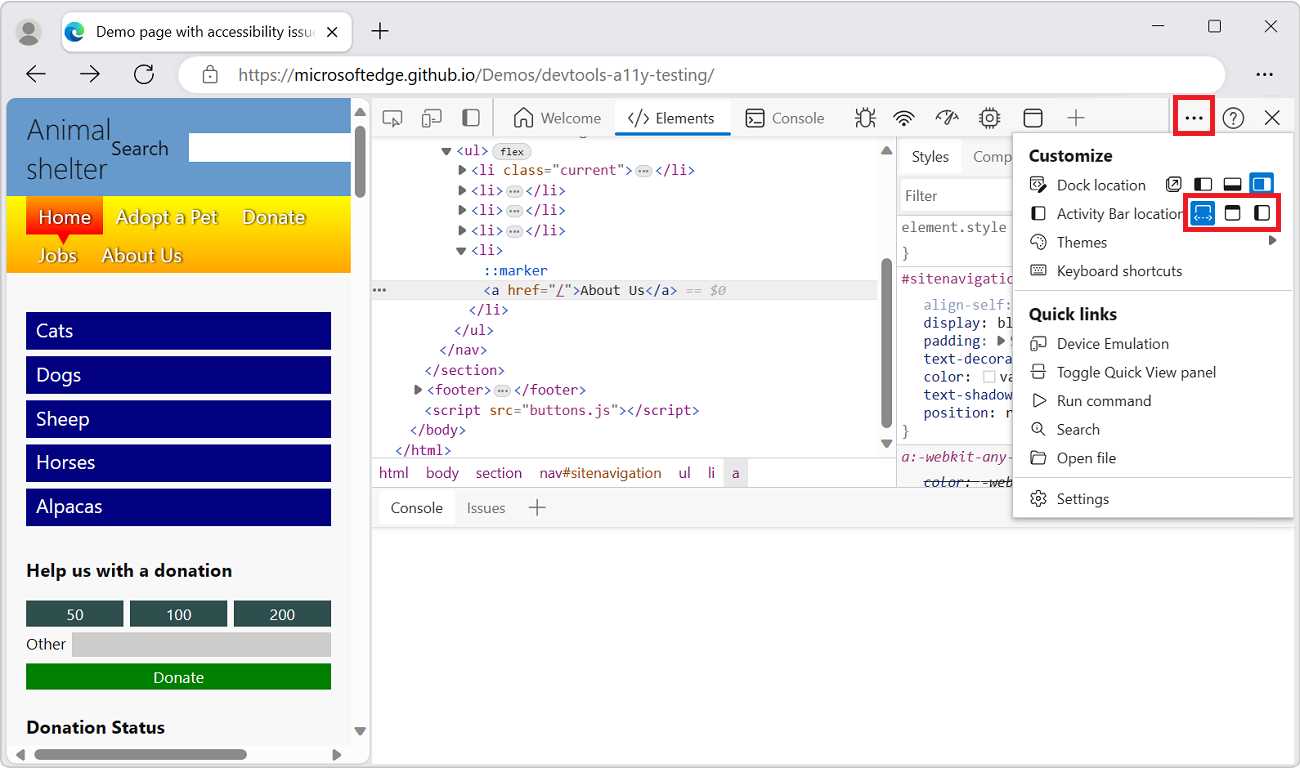
Follow these steps to efficiently debug a website:
- Activate Developer Tools: Open the developer tools in your browser, usually by right-clicking on the page and selecting “Inspect” or pressing
F12. - Identify the Problematic Element: Click on the specific part of the page that’s causing issues to highlight it in the code view.
- Review the Code and Styles: Examine both the HTML structure and CSS styles associated with the element. Look for errors, missing files, or improper syntax.
- Test Changes in Real-Time: Modify values directly in the developer tools to observe how changes affect the page instantly. This allows you to experiment and see potential fixes without committing to permanent edits.
- Reproduce the Issue: Try to replicate the issue by interacting with the page as a user would. Look for any differences between your edits and the problem, and adjust accordingly.
By integrating these debugging techniques into your workflow, you can streamline the process of identifying and resolving issues on your website, saving time and improving the overall user experience.
Using Inspect to Identify Broken Links
Links are essential to a website’s navigation, allowing users to access various pages or external resources. However, sometimes these links may become broken due to changes in URLs, deleted pages, or other issues. Identifying and fixing these broken links is crucial for maintaining a seamless user experience and ensuring your site remains functional. By examining the source code of a page, you can quickly locate and verify any problematic links.
How to Spot Broken Links
When troubleshooting broken links, you can focus on certain indicators in the page’s HTML structure. Here’s how to locate them:
- Check Anchor Tags: Broken links typically appear within
<a>tags, where thehrefattribute contains the URL. If the link is incorrect or leads to a 404 page, it may be a broken link. - Look for Error Responses: If the link points to a resource that no longer exists, it may return an error such as
404 Not Foundor403 Forbidden. These errors are often displayed in the developer tools console. - Verify External Links: External links should be checked for validity by inspecting the
hrefattribute. If they lead to non-existent websites or incorrect paths, they should be updated.
Steps to Identify and Fix Broken Links
To find and address broken links on your website, follow these steps:
- Open Developer Tools: Access the browser’s developer tools (usually by right-clicking on the page and selecting “Inspect” or pressing
F12). - Search for Anchor Tags: Use the “Elements” tab to locate all anchor tags (
<a>) within the page’s HTML structure. You can do this by expanding sections of the code or using the search functionality within the developer tools. - Check the Href Attribute: Examine each anchor tag’s
hrefvalue to ensure it links to a valid destination. Broken links often have URLs that result in errors when accessed. - Test the Links: After identifying potentially broken links, manually test them by clicking or entering the URL in your browser to verify whether they lead to the correct page or an error.
- Update or Remove Broken Links: Once you’ve found a broken link, either update the URL with the correct path or remove the link entirely to ensure a smooth user experience.
By regularly checking for and fixing broken links, you can maintain a well-functioning website that provides users with accurate and accessible content.
How Inspect Element Helps in SEO
Search engine optimization (SEO) plays a crucial role in ensuring that a website ranks well in search engine results. Optimizing a site’s structure, content, and performance is key to improving its visibility. One of the most powerful tools for this task is the ability to analyze and adjust the underlying code of a page. By examining how a webpage is built, SEO specialists can identify opportunities for improvement, fix technical issues, and ensure that the page is optimized for both users and search engines.
When working on SEO, understanding the HTML structure, meta tags, and overall page content is essential. Through a thorough review of these elements, it becomes easier to spot issues that may be affecting the site’s performance, whether that involves incorrect meta descriptions, missing alt text, or improperly structured headings. In turn, these insights help optimize the site for better ranking.
Optimizing Meta Tags and Content
Meta tags such as the title, description, and keywords are vital for search engines to understand a page’s content. Analyzing these tags in the HTML code allows for better control over how the page is indexed and displayed in search results. By ensuring that these elements are correctly implemented, you can improve the click-through rate (CTR) and visibility.
- Title Tag: Ensure that the
<title>tag is descriptive and includes important keywords relevant to the page. - Meta Description: The
<meta name="description">tag should provide a concise summary of the page, encouraging users to click through from search engine results. - Alt Text for Images: Inspect image tags (
<img>) to ensure thatalttext is properly used, which helps search engines understand what the image is about and improves accessibility.
Improving Website Performance and Structure
Page speed and user experience are significant ranking factors for search engines. By analyzing the resources loaded on a page, you can identify large files or scripts that slow down performance. Additionally, examining the HTML structure of the page helps identify issues with internal linking, heading hierarchy, and content organization, all of which are important for both users and search engines.
- Page Speed: Use developer tools to analyze network activity and identify slow-loading assets, such as large images or external scripts.
- Heading Tags: Ensure that heading tags like
<h1>,<h2>, and<h3>are used properly to structure the content and improve readability for search engines. - Internal Linking: Check the internal link structure to ensure that pages are well connected, helping search engines crawl the site effectively.
By leveraging these insights, you can ensure that your website is properly optimized for search engines, improving visibility, usability, and ultimately, search rankings.
Tracking JavaScript Errors with Inspect
JavaScript plays a critical role in creating dynamic and interactive web pages. However, errors within the code can often lead to issues with functionality, affecting user experience. Identifying and resolving these errors is essential for ensuring smooth operation of a website. By examining the scripts running on a page, developers can track issues in real-time and quickly address problems that may arise.
One of the most effective ways to track JavaScript errors is by utilizing the built-in developer tools provided by modern browsers. These tools allow developers to access a detailed log of all errors encountered while a page is being executed. This real-time feedback is invaluable for troubleshooting and debugging, helping to identify faulty scripts and pinpoint areas that require attention.
Identifying Errors in the Console
The console is an essential feature within developer tools, displaying error messages and warnings that occur during page load or interaction. These messages can provide critical information, such as the line number where the error occurred, the type of error, and a stack trace to help identify the root cause.
Some common types of errors to look for include:
- Syntax Errors: Occur when there is an issue with the code structure, such as missing parentheses or semicolons.
- Reference Errors: Happen when a variable or function is referenced before it is defined.
- Type Errors: Arise when a function or variable is used in an unexpected way, such as trying to call a non-function as a function.
Viewing Detailed Error Information
When a JavaScript error is logged, developers can click on the error message to view more details. This usually includes the file name, line number, and even a snippet of the code where the issue occurred. This detailed view is critical for understanding the context of the error and making informed decisions about how to fix it.
In addition to the console, developers can also use breakpoints to pause script execution at specific points, which allows for a more in-depth analysis of the issue. By stepping through the code line-by-line, developers can observe how variables change and identify the precise location where the error occurs.
Example of JavaScript Error Log
| Error Type | Description | File | Line |
|---|---|---|---|
| Syntax Error | Unexpected token in the code. | script.js | 23 |
| Reference Error | Function not defined before usage. | app.js | 45 |
| Type Error | Trying to call undefined as a function. | main.js | 67 |
By actively monitoring the console and utilizing debugging tools, developers can efficiently track and resolve JavaScript errors, ensuring the functionality and reliability of the website.
Customizing the View for Testing
In web development, testing the layout and functionality of a page under different conditions is crucial to ensure it performs well across various devices and screen sizes. Developers often need to alter the way a page is displayed to simulate different environments, which helps to identify potential issues before they affect end users. By modifying the visible elements or dimensions of a page, developers can simulate user experiences under a wide range of scenarios.
One of the most efficient ways to achieve this is by customizing the viewport directly through the browser’s built-in tools. These tools allow for the manipulation of page appearance in real-time, providing instant feedback on how the page adapts to different screen resolutions, aspect ratios, or device orientations.
Adjusting the Device Simulation
Modern web browsers offer device simulation features that allow developers to mimic various mobile and desktop devices. This includes changing the screen size, resolution, and even the device’s user interface elements, such as the toolbar and scroll bars. By toggling these settings, it becomes easier to test the responsiveness of the page and ensure it behaves as expected on different platforms.
Common device types that can be simulated include:
- Mobile Phones: Testing for small screens, touch interactions, and mobile-friendly layouts.
- Tablets: Examining mid-sized screens to ensure proper scaling of content and navigation.
- Desktops: Ensuring that desktop views display content appropriately on larger screens.
Modifying the Page Elements
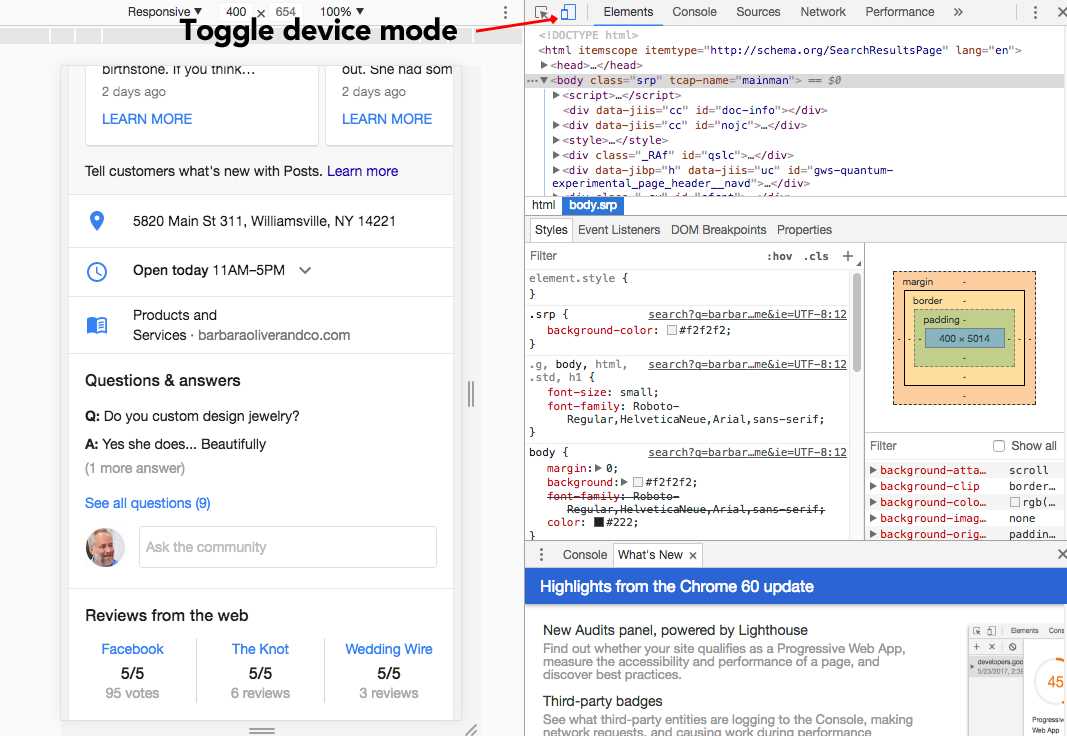
Another useful feature is the ability to directly manipulate page elements and their styles. This can be particularly helpful for testing various visual adjustments, such as font sizes, colors, and layouts. Developers can modify CSS properties in real-time to see how small changes affect the page, allowing for rapid iteration and testing of design choices.
For instance, a developer can:
- Change text size: Test legibility and readability across devices.
- Adjust margins and padding: Ensure proper spacing between elements.
- Test color contrast: Check accessibility standards for visual elements.
By customizing the view during the testing phase, developers can ensure that all elements of a page are displayed correctly and function as intended, regardless of the device or screen size used by the end user.
How Inspect Element Improves Development
In modern web development, having efficient tools for testing, debugging, and iterating on projects is essential for producing high-quality results. By providing immediate access to a page’s structure and style, developers can quickly diagnose issues, refine designs, and improve overall functionality. These capabilities streamline the development process, saving both time and effort while allowing for rapid adjustments and improvements.
One of the key benefits of such tools is the ability to experiment and troubleshoot without needing to make permanent changes to the codebase. This flexibility allows developers to test potential modifications in real-time and view the outcomes instantly, reducing the time spent on identifying and fixing issues. Whether it’s adjusting a layout, correcting JavaScript errors, or ensuring proper element positioning, these tools significantly enhance the development workflow.
Speeding Up Debugging and Troubleshooting
By directly interacting with the page’s code, developers can instantly identify and fix bugs or performance issues. Instead of spending valuable time searching through files and logs, developers can examine the exact part of the page causing the issue and address it on the spot. This leads to faster problem resolution and a smoother development cycle.
- Efficient Error Detection: Quickly spot broken links, missing resources, or other issues that may affect the page’s performance.
- Real-Time JavaScript Debugging: Pause and step through scripts to locate and fix errors without reloading the page.
- Element Manipulation: Adjust HTML and CSS directly to see how changes affect the layout and style of the page.
Enhancing Collaboration and Communication
These tools also help improve communication between developers, designers, and other team members. By providing an interactive view of the page, developers can easily explain design changes or pinpoint issues without needing to rely on complex documentation or lengthy descriptions. This shared visual context makes it easier for team members to align on goals and make decisions more effectively.
- Design Feedback: Designers can see the impact of changes in real time and suggest adjustments based on immediate feedback.
- Cross-Disciplinary Understanding: Non-developers, such as marketers or content creators, can also interact with the page’s structure to provide informed input.
Overall, these tools play a crucial role in making development faster, more efficient, and collaborative. By offering a direct view into the page’s code, they empower developers to make informed decisions and deliver high-quality websites more efficiently.
Using Console for Webpage Analysis
The developer console is a powerful tool for gaining deeper insights into how a webpage is performing, both in terms of functionality and structure. By interacting with the console, developers can execute scripts, monitor errors, and analyze network activity–all in real time. This allows for quick identification of performance issues and bottlenecks that might otherwise go unnoticed.
With the console, developers can easily track JavaScript errors, log specific messages, or even manipulate the DOM to test various outcomes. The flexibility of this tool helps streamline debugging and testing processes, enabling immediate feedback and adjustments. It is especially useful for identifying problems related to client-side code, such as broken scripts, slow load times, or incorrect behavior.
Furthermore, the console provides an interface for interacting with the webpage through JavaScript commands. This allows developers to query elements, run diagnostics, and test custom functions without the need for page reloads or external tools. This capability accelerates the troubleshooting process and enhances the developer’s ability to analyze and refine web applications efficiently.
Inspecting Network Requests and Responses
Analyzing network requests and their corresponding responses is essential for understanding how a webpage communicates with external resources. This process involves monitoring the traffic between the browser and the server to ensure proper data exchange and identify any issues that may hinder performance or functionality.
By reviewing network activity, developers can track the loading time of assets like images, scripts, and stylesheets. This information is crucial for optimizing page speed and ensuring a smooth user experience. Additionally, network requests provide insight into how data is fetched from APIs, which can help pinpoint problems like failed requests, incorrect responses, or inefficient data handling.
In the network monitoring section, developers can see the status codes for each request, such as 200 (OK), 404 (Not Found), or 500 (Server Error). These status codes give immediate feedback about the health of the page and any resources that may be missing or malfunctioning. Through this analysis, developers are able to address performance bottlenecks and resolve connectivity issues effectively.
Ethical Considerations When Using Inspect
When exploring the inner workings of a website through developer tools, it is important to maintain ethical standards. While the tools are valuable for learning, testing, and troubleshooting, they can also be misused for unauthorized activities. Understanding the line between legitimate use and unethical behavior ensures that these tools contribute to development and not exploitation.
One of the main ethical concerns is respecting the privacy of users and the security of the website. Accessing sensitive data or exploiting vulnerabilities without permission is illegal and unethical. Similarly, using the information gathered for malicious purposes, such as stealing content, injecting harmful scripts, or bypassing security measures, is strictly prohibited.
Another consideration is the impact of inspecting pages on the server’s resources. Excessive requests or probing can put unnecessary strain on a website’s performance, especially if done repeatedly or on a large scale. While testing your own pages is perfectly fine, probing others’ websites without consent can negatively affect their operations.
| Action | Ethical Consideration |
|---|---|
| Analyzing source code | Ensure it’s for educational or troubleshooting purposes, not for copying or stealing content |
| Testing functionality | Always seek permission when probing websites you don’t own |
| Accessing user data | Never access or misuse any personal or sensitive information |
| Bypassing security features | Always respect security protocols; avoid exploiting weaknesses |
By adhering to ethical practices, developers can use these powerful tools responsibly and ensure that their work contributes positively to the online community. The right approach encourages innovation, education, and safe online experiences for all users.